📈 Compass Pulse 2025: Mapping Signals Across Sectors
Compass Pulse 2025 is designed to decode the technical overlays that guide India’s equity markets. While IPO sparks ignite momentum and dividend anchors provide stability, Compass Pulse focuses on the signals beneath the surface — RSI, MACD, and volatility grids that reveal sector divergences. This post is the technical lens of your trilogy, complementing IPO Landscape India December 2025 and Dividend Anchors 2025.
Compass Pulse 2025: Metals Momentum
The metals sector shows strong RSI readings above 60, led by Hindalco and Tata Steel. MACD overlays confirm bullish crossovers, suggesting sustained strength. Volatility spikes, however, remind investors that momentum can exaggerate short‑term moves. Compass Pulse signals here are clear: metals remain a defensive growth arc, but allocation discipline is essential.
Compass Pulse 2025: IT Divergence
IT overlays present a mixed picture. Tech Mahindra and Infosys show RSI stability near 55, while mid‑tier IT firms remain below 45. MACD grids highlight flat momentum, masking divergence within the sector. Compass Pulse signals suggest resilience in large caps but caution in mid‑caps. This divergence is noise investors must filter to avoid overgeneralization.
Compass Pulse 2025: FMCG Anchor
FMCG overlays reveal RSI near 42, with HUL oversold and Colgate weak. MACD confirms bearish bias. Yet Compass Pulse highlights the anchor effect: FMCG remains structurally strong, and oversold signals often precede normalization. For investors, patience is the strategy — waiting for RSI recovery before re‑entry.
Compass Pulse 2025: Infra Core
Infra overlays show RSI at 44, MACD bearish, with Tata Power softening. Compass Pulse signals weakness, but the narrative arc is opportunity. Infra remains central to India’s growth story, and technical weakness may mask selective strength in niche players. Investors must treat infra overlays as long‑term thematic signals rather than short‑term trades.
Compass Pulse 2025: Energy Breakout
Energy overlays are bullish, RSI above 62, with Reliance nearing breakout territory. MACD confirms upward momentum. Compass Pulse signals strength, but volatility grids warn of swings tied to global crude and policy cues. The signal is momentum; the noise is short‑term volatility. Investors must filter wisely to capture long‑term energy transitions.
Compass Pulse 2025: Dividend Arc Integration
Dividend ETFs, such as CPSE, act as stabilizers within Compass Pulse overlays. Yield signals (3.5–5%) provide ballast when sector overlays swing with momentum. This integration ties Compass Pulse back to Dividend Anchors 2025, reinforcing the trilogy’s theme: sparks, anchors, and signals working together.
Investor Psychology in Compass Pulse
Technical overlays shape investor psychology. RSI oversold zones trigger fear, while MACD bullish crossovers spark optimism. Compass Pulse 2025 emphasizes that signals must be interpreted within narrative arcs — IPO sparks, dividend anchors, and ETF signals. Without context, overlays risk becoming noise rather than guidance.
Practical Application
📊 Compass Pulse 2025 — RSI & MACD Grid
| Sector | RSI Value | MACD Signal | Investor Takeaway |
|---|---|---|---|
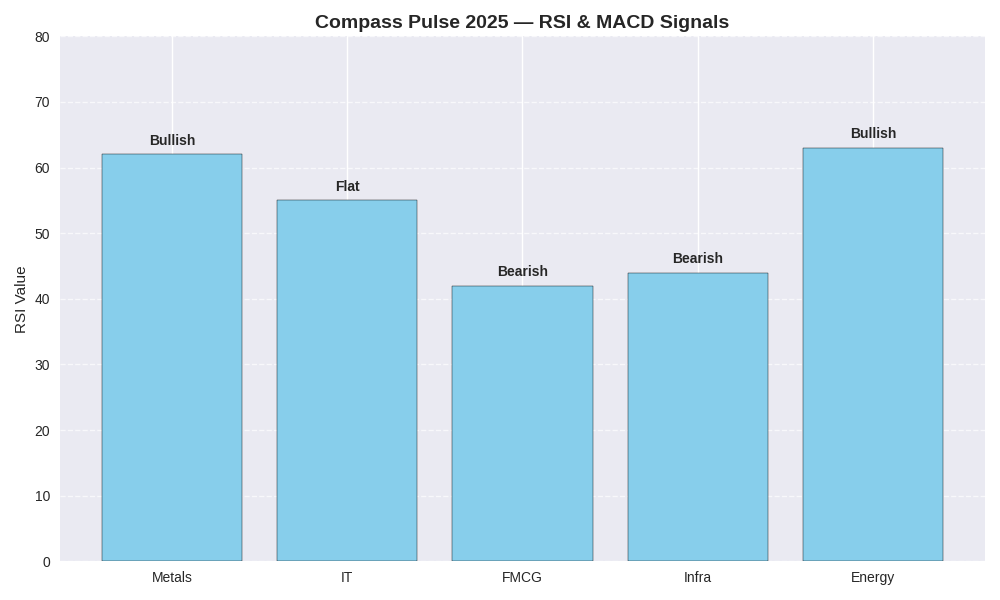
| Metals | 62 | Bullish | Strong momentum; allocate defensively but stay disciplined. |
| IT | 55 | Flat | Stability in large caps; divergence hidden in mid‑caps. |
| FMCG | 42 | Bearish | Oversold; patience required before re‑entry. |
| Infra | 44 | Bearish | Weakness masks long‑term opportunity; treat as thematic bet. |
| Energy | 63 | Bullish | Breakout momentum; volatility risk tied to global crude. |
🔑 How to Use This Grid
- Signals: RSI > 60 = bullish strength; RSI < 45 = caution zones.
- Noise: MACD flat or bearish = divergence or weakness.
- Anchor: Dividend ETFs (CPSE, PSU yields) balance momentum swings.
The Compass Pulse 2025 grid distills sector overlays into actionable signals. Metals and energy show powerful bullish strength, IT remains stable but divergent, FMCG is oversold, and infra reflects weakness masking opportunity. Dividend ETFs act as anchors, reminding investors that yield stability balances momentum swings. This table complements the RSI/MACD chart, offering readers both a visual and textual lens to interpret signals in the noise.
Compass Pulse overlays can be integrated into portfolio trackers. By mapping RSI/MACD grids weekly, investors can visualize divergence zones and align allocations with thematic arcs. For example, a Compass Tracker grid can highlight metals bullishness, FMCG oversold patience, and energy breakout momentum, offering a holistic technical view.
Closing Note
Compass Pulse 2025 is not about chasing every chart pattern. It is about discerning clarity in technical overlays, balancing momentum with yield, and aligning portfolios with thematic arcs. Together with IPO sparks and dividend anchors, Compass Pulse completes the trilogy — offering investors a holistic view of India’s capital markets in December 2025.
For authoritative updates, explore NSE India Technical Indicators and Moneycontrol Sector Charts.